

In short
Worldwide, soybean yield averaged 2.78 tonnes per hectare in 2024 according to FAO, and national averages among producers around the Black Sea, in the Caucasus and in Central Asia ran from 0.56 t/ha in Azerbaijan to 4.12 t/ha in Turkey.
Inside one country the gap can be larger still, because soybean depends on warm, moist summers or on irrigation, and loses most where either is missing. Planva keeps the yield of each field and season in crop rotation, so a farm can compare its own fields with the national averages below.
Soybean yield by country, 2022 to 2024
FAO publishes national averages in tonnes per hectare. The table covers producers around the Black Sea, in the Caucasus and in Central Asia, a few large producers for scale, and the world average.
| Country | 2022, t/ha | 2023, t/ha | 2024, t/ha |
|---|---|---|---|
| Turkey | 4.08 | 4.21 | 4.12 |
| Georgia | 3.00 | 3.00 | 2.00 |
| Kazakhstan | 1.96 | 2.05 | 2.10 |
| Azerbaijan | 0.56 | 0.56 | 0.56 |
| Ukraine | 2.26 | 2.59 | 2.44 |
| Romania | 1.90 | 2.26 | 2.17 |
| Serbia | 1.69 | 2.84 | 1.58 |
| Italy | 2.75 | 3.53 | 3.34 |
| United States | 3.33 | 3.40 | 3.41 |
| Brazil | 2.95 | 3.43 | 3.15 |
| Argentina | 2.76 | 1.74 | 2.95 |
| World | 2.63 | 2.70 | 2.78 |
Read the small and flat series with care. Values that barely move from year to year, such as 0.56 t/ha for Azerbaijan in all three years, point to estimated or small-scale reporting. Argentina shows the opposite. Its yield went from 2.76 t/ha to 1.74 and back to 2.95. Check national statistics before using a single year as a benchmark.
One country, two yield levels: Kazakhstan
A 2025 review of soybean seed production in Kazakhstan, by Kushanova and colleagues, shows how much the same crop depends on place. In 2021 the national average was 2.11 t/ha. Almaty region reached 2.38 t/ha, while the northern regions did not get close.
| Region | Yield in 2021, t/ha |
|---|---|
| Almaty | 2.38 |
| East Kazakhstan | 0.86 |
| North Kazakhstan | 0.67 |
| Kostanay | 0.46 |
| Kazakhstan, average | 2.11 |
The authors report that more than four fifths of the soybean area sits in Almaty and Zhetysu regions, and that those two regions gave about nine tenths of national output in 2022 to 2024. National area fell from about 138 thousand ha in 2019 to 100 thousand ha in 2024 because northern sowings shrank. Under drip irrigation in the south-east the yield is reported to reach up to 5.5 t/ha. That figure is a ceiling for good conditions, not an average.
Where the water has to be
Wisconsin extension specialists Conley and Gaska identify two moments when soil moisture matters most for soybean: at planting, and from bloom through pod fill. The period from stand establishment to bloom is less critical. In the reproductive stages the crop uses about a quarter to a third of an inch of water per day, which is roughly 6 to 8 mm. A shortage makes flowers and young pods abort and reduces the number of seeds per plant.
The same authors point out that in most years on medium and fine soils in Wisconsin, water was not the main limit. Irrigated and rainfed soybeans gave the same yield in trials from 1996 to 2000, although irrigated plants carried more leaf and stem. Use that as a reminder that irrigation pays where rainfall at bloom and pod fill is short, not everywhere. They also note that low soil pH inhibits nodulation and makes plants more prone to drought injury.
Setting a yield reference for your fields
- Separate irrigated and rainfed fields. Their averages describe different crops.
- Match the maturity group to the season. The Kazakh review lists a group II variety at 125 to 130 days in Almaty region and group III varieties at 130 to 140 days.
- Record the bloom and pod fill period. If a dry spell fell there, note it next to the yield.
- Keep weeds in the record. A weedy field and a clean one under the same rain are not comparable.
How this works in Planva
- Crop rotation by season. Crop, variety, sowing and harvest dates, yield in c/ha and harvest in tonnes for each field. Ten c/ha equal one t/ha.
- Seed catalogue. Reproduction, germination, 1000-seed weight, maturity group and purity for each variety.
- Inspections. Templates, inspection tasks and phytosanitary reports for diseases, pests and weeds.
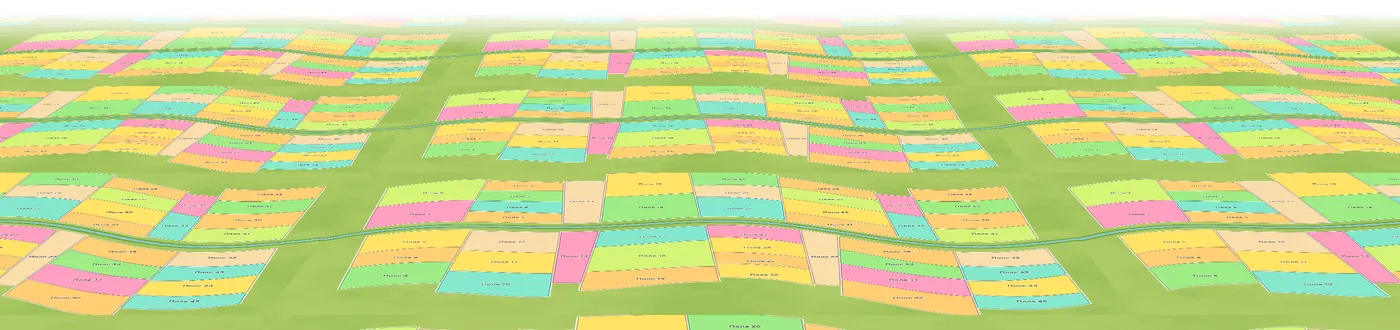
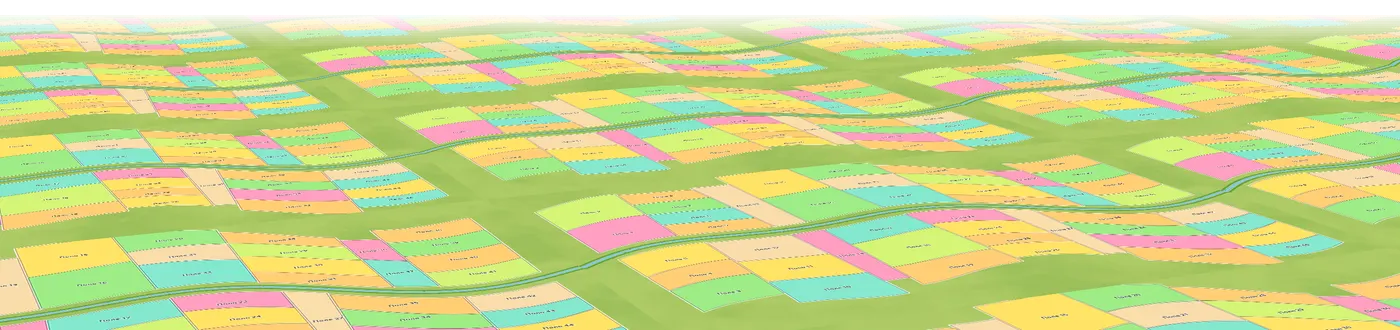
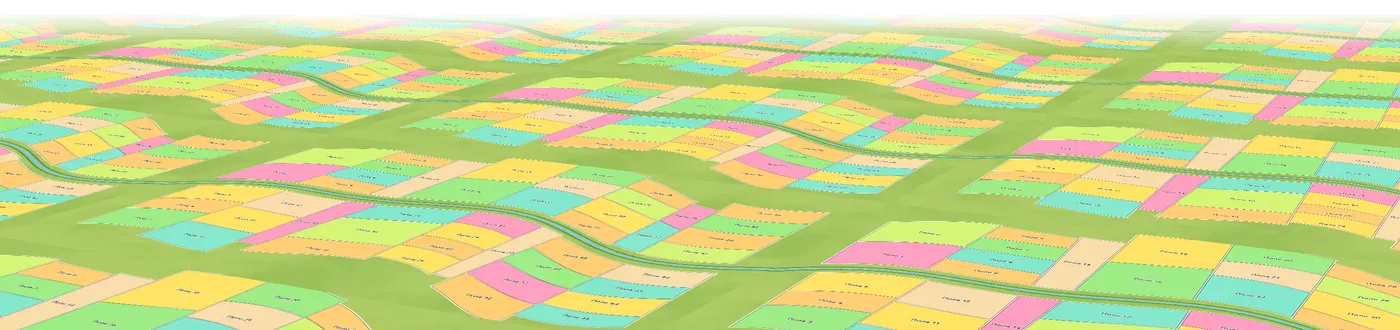
- Rotation map. A crop filter prints to PDF or JPEG with an area summary.
Planva records these facts and does not set yield targets or give agronomic recommendations. See the crop rotation guide for how soybean fits into a sequence, and field history records for what to keep per field.
Sources
Common questions
The FAO world average was 2.78 t/ha in 2024. Irrigated, warm regions sit well above it and dry or cool ones well below, as Kazakhstan shows with 2.38 t/ha in Almaty region and 0.46 t/ha in Kostanay in 2021. Compare with your own fields first.
The real Planva interface, shown with test data.