


In short
Maize yielded 5.8 tonnes per hectare worldwide in 2024 according to FAOSTAT, and the countries tabled below ran from 3.1 in Georgia to 11.9 in Uzbekistan.
A corn yield only means something at a stated grain moisture, because wet grain weighs more. Planva keeps corn yield per field and season with the hybrid and sowing and harvest dates, so each result stays tied to what produced it.
Maize yield by country
National averages from FAOSTAT for maize (corn) in tonnes per hectare of harvested area. The last column is the lowest and highest year from 2020 to 2024.
| Country | 2022 | 2023 | 2024 | Range 2020 to 2024 |
|---|---|---|---|---|
| Kazakhstan | 5.8 | 6.2 | 6.2 | 5.8 to 6.2 |
| Uzbekistan | 10.5 | 12.7 | 11.9 | 9.1 to 12.7 |
| Azerbaijan | 8.8 | 10.0 | 10.8 | 8.7 to 10.8 |
| Georgia | 2.1 | 2.6 | 3.1 | 2.1 to 3.1 |
| Armenia | 5.2 | 7.7 | 5.2 | 5.2 to 7.7 |
| Kyrgyzstan | 6.8 | 7.1 | 7.3 | 6.5 to 7.3 |
| Turkey | 9.3 | 9.4 | 10.3 | 8.9 to 10.3 |
| Ukraine | 6.3 | 7.8 | 6.6 | 5.6 to 7.8 |
| United States | 10.9 | 11.1 | 11.3 | 10.8 to 11.3 |
| France | 7.5 | 9.8 | 9.2 | 7.5 to 9.9 |
| Germany | 8.4 | 9.6 | 10.1 | 8.4 to 10.4 |
| World | 5.7 | 5.9 | 5.8 | 5.7 to 5.9 |
In absolute terms maize has the widest spread of the three crops, from 3.1 to 11.9 t/ha in 2024, and neighbours can sit far apart: Azerbaijan reached 10.8 and Georgia 3.1. The table does not say how much of each country is irrigated, so do not read it as a ranking of farmers.
Fix the moisture before you compare
Grain leaves the field wetter than it is sold or stored. A yield weighed at harvest moisture is higher than the same grain dried to the base moisture, so two fields can only be compared at the same basis. The conversion keeps the dry matter constant.
Yield at base moisture = weighed yield x (100 - W) / (100 - W base), where W is the moisture of the weighed grain and W base is the moisture the buyer or the national grain standard uses, both in per cent. Example: 10 t weighed at 24 per cent moisture, with a base of 14 per cent, is 10 x 76 / 86 = 8.8 t at base. The 14 is only an example. Use the base in your contract.
Where a corn yield comes from
A field practice guide from Kazan Federal University describes the structure of a maize crop. Plants are sampled at ten points in at least four replications. The plants with no ear, one ear, or two or more ears are counted, ears per plant are averaged, and plants and ears are weighed separately. From counts like these a simple calculation gives the biological yield before harvest losses: plants per hectare x ears per plant x grain weight per ear. That calculation is ours, not the guide method.
- Plants per hectare. Set at sowing and lowered by emergence and stand losses.
- Ears per plant. Some plants carry none, some two or more.
- Grain per ear and grain weight. Settled late in the season, which is why a good stand can still disappoint.
Your own corn fields
- Weigh and note the moisture. Record harvested tonnes and the grain moisture at weighing.
- Convert to your base. Use the formula above, then divide by harvested hectares.
- Keep the hybrid and dates. A result without them cannot be traced to a cause.
- Compare with the same field first. Its earlier seasons say more than a country average.
To move from sample counts to a hectare figure, see how to calculate crop yield. The same table for the main small grain is in wheat yield.
How this works in Planva
- Crop rotation by season. Crop, variety, sowing and harvest dates, yield and total harvest for each field.
- Seed catalogue. Reproduction, germination, 1000-seed weight, maturity group and purity for each seed record.
- Plan and actual. Agroplans hold seed by rate or quantity, planned and applied.
- What it does not do. Planva records the result. It does not convert moisture or recommend hybrids.
Sources
Common questions
FAOSTAT gives 5.8 t/ha for maize worldwide in 2024. Among the countries tabled the range was 3.1 t/ha in Georgia to 11.9 t/ha in Uzbekistan.
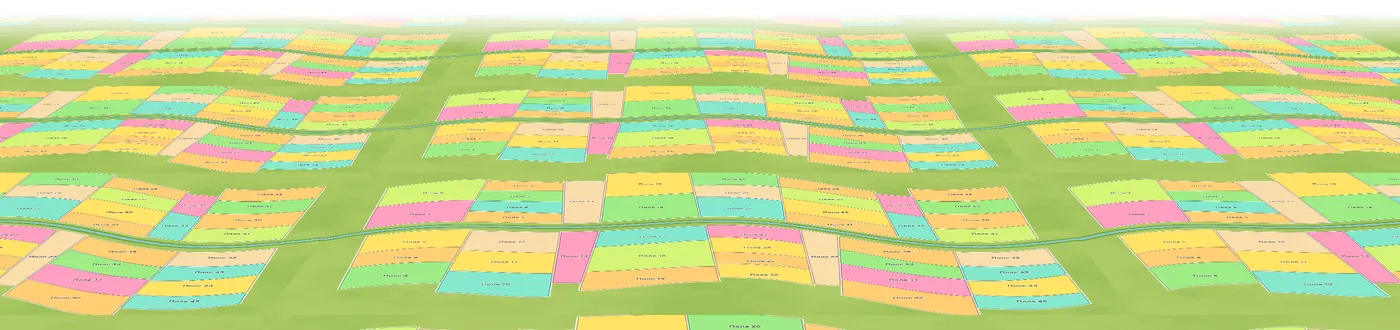
The real Planva interface, shown with test data.